 |
|
|
| Massachusetts Institute of Technology |
|
Integrated Program on Molina Center for Energy and the Environment Voice: (858) 657 Fax: (858) 657- E-mail: info@mce2.org |
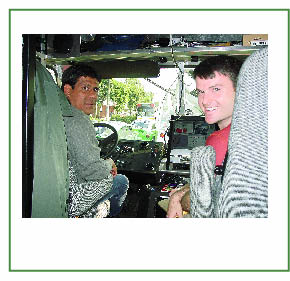
Taxis and Pollution in Mexico CityContributed by Bernardo Navarro Benítez
Taxis and the CityWithin the public transportation in the Federal District (DF), taxis have the largest fleet, adding between 103,000 to 106,000 formally registered units, besides the unregistered ones, popularly known as “pirates.” Hence, the taxi fleet is three times higher to that of ‘colectivos’ (minibuses) –see Table 1– although colectivos make 58% of the total trips in the city and taxis only 4.4% of them. The number of registered taxis per habitant is larger than that of cities like Madrid, Paris and even Sao Paulo and New York City. In order to add up the total number of taxis in the city, we must add 6,109 units of the neighboring municipalities of the State of Mexico, besides the considerable number of “pirates” in these municipalities. Of the total ‘registered’ metropolitan fleet, 56% is made out of models 1992 and earlier, meaning that they do not have any anti-pollutant systems and are thought to contribute about 158,000 tons of pollutants annually. 1 It is estimated that in the DF close to 90% of the vehicles ride under the modality of “free taxis” and only the other 10% belongs to one of the more organized modalities: Radio Taxi, Stand Taxi or Tourist Taxi. Characteristics of the fleet and serviceTaxis are very important not only for the public service they provide to the occasional and habitual users, but also for the employment and income source they represent for a large sector of the city’s society. It is calculated that around half a million Mexicans depend on this activity. But also, the vehicles used for this service are important consumers of fossil fuels and, due to the age of its fleet and to the particular operational an organizational conditions, have an important impact on the environment of the metropolis, as they represent only 2.9% of the metropolitan fleet, but contribute with 13.3% of the main air pollutant emissions generated from the passenger transportation fleet. It is beyond doubt that the taxi sector needs an urgent modernization in various aspects for the benefit of the environment, as well as that of the taxi-operator, the concessionaries, its organizations and the people in general. Presently, there are 324 taxi organizations in the DF. From this total, 94% (305) have adopted the form of Civil Association (Asociación Civil), and the other 6% (19) have turned into an organization under the form of a Mercantile Association (Sociedad Mercantil). As Table 2, the evolution of the taxi vehicle fleet has been vertiginous between 1988 and 2000, growing more than double in only 12 years, a period in which the DF slowed down its demographic growth rate and even expelled population from its territory. This is why we underlined above that taxis, besides being a strategic service, has also represented an opportunity for self employment, particularly during the years of “economic adjustment” when hundreds of thousands of jobs were eliminated in the formal sector. What about the “pirates”?One of the biggest questions in the sector is the large number of “pirate” units in this activity. As part of the UAM- MIT project, we were able to make an approximation through a counting method of the number of “pirate” taxis circulating in the DF: in a period of one week, we made 30 surveillance between 2:00 and 7:00 pm at a fixed crossroad in the city, counting 1500 taxis. Out of this total, 224 units did not have the attributes that could certify them as regulars, and 1276 were registered as legal. This means that practically 15% of the units were irregular (14.9%), which, if extrapolated to the total number of taxis in the DF would represent the existence of 15,000 irregular vehicles. However, the total number of irregular taxis might be a bit larger, around 18,000, as they are generally located around the bus terminals and in the border with the neighboring municipalities. However, because of the same nature of the service they provide, taxis end up running through the main roads of the city. A larger concentration of irregular taxis was observed during the evening in the counting exercise, at which the percentage of irregular taxis fluctuated between 22 and 24%. Taxis and the environmentThe contribution of pollutants from taxis is, in order of importance, the third within the transportation of people, and fourth if we include cargo transportation. As shown in Table 3, for the year 2001, taxis contributed 8.82% of pollutants included, but represent only 4.4% of the total number of trips in the MCMA. Also, the negative impact of used tires and oils on water and soil should be added, as a large percentage of the fleet gets their maintenance not in shops but in public roads. The disproportionate impact of taxis is related mostly to the age of its fleet, oversupply of service, and its particular forms of exploitation. Public actions for improving the taxi serviceProbably due to the described characteristics, a number of public policies to improve taxi service had been decided by December 2000, trying, at the same time, to improve its environmental impacts. Among the actions that stand out, we find:
Table 2 . Evolution of Fleet of Free and Stand Taxi Service in DF. %TCRFTP: Porcentaje total con respecto a la flota total de pasajeros. 1) FTTP: Flota total transporte concesionado de pasajeros: Sedán, Combi y Minibús. Table 3 . Means of Transportation and Pollutant Contributions to the Environment in MCMA. These important policies have had important advances but have also found severe limitations that are inherent to the characteristics of the sector. This way, for example, the suspension of new concessions has been limited with the “pirates,” as well as by the management of the concessions by powerful groups and corruption. The vehicle substitution faces the challenge of credit accessibility needed to buy new cars and the oversupply of the taxi service. As for the campaigns against the “pirates,” these have to fight corporatism, judicial gaps and ambiguities, as well as corruption. Conclusions
Table 1. Daily Trips and Vehicle Fleet of Public Transportation in the DF.
Source: Secretaría de Transporte y Vialidad, GDF,1999. * Trolley bus and light train.
%TCRFTP: Porcentaje total con respecto
a la flota total de pasajeros. Table 3. Means of Transportation and Pollutant Contributions to the Environment in MCMA.
Bernardo Navarro Benítez is a
researcher at the Universidad Autónoma Metropolitana-Xochimilco.
This work is supported by the Integrated Program on Urban, Regional
and Global Air Pollution with funds from Comisión Ambiental
Metropolitana.
1 Gobiernos del Distrito Federal, Estado de México y Federación. Programa para el Mejoramiento de la Calidad del Aire de la ZMVM 2002-2010 . México, 2003, 8-20. |